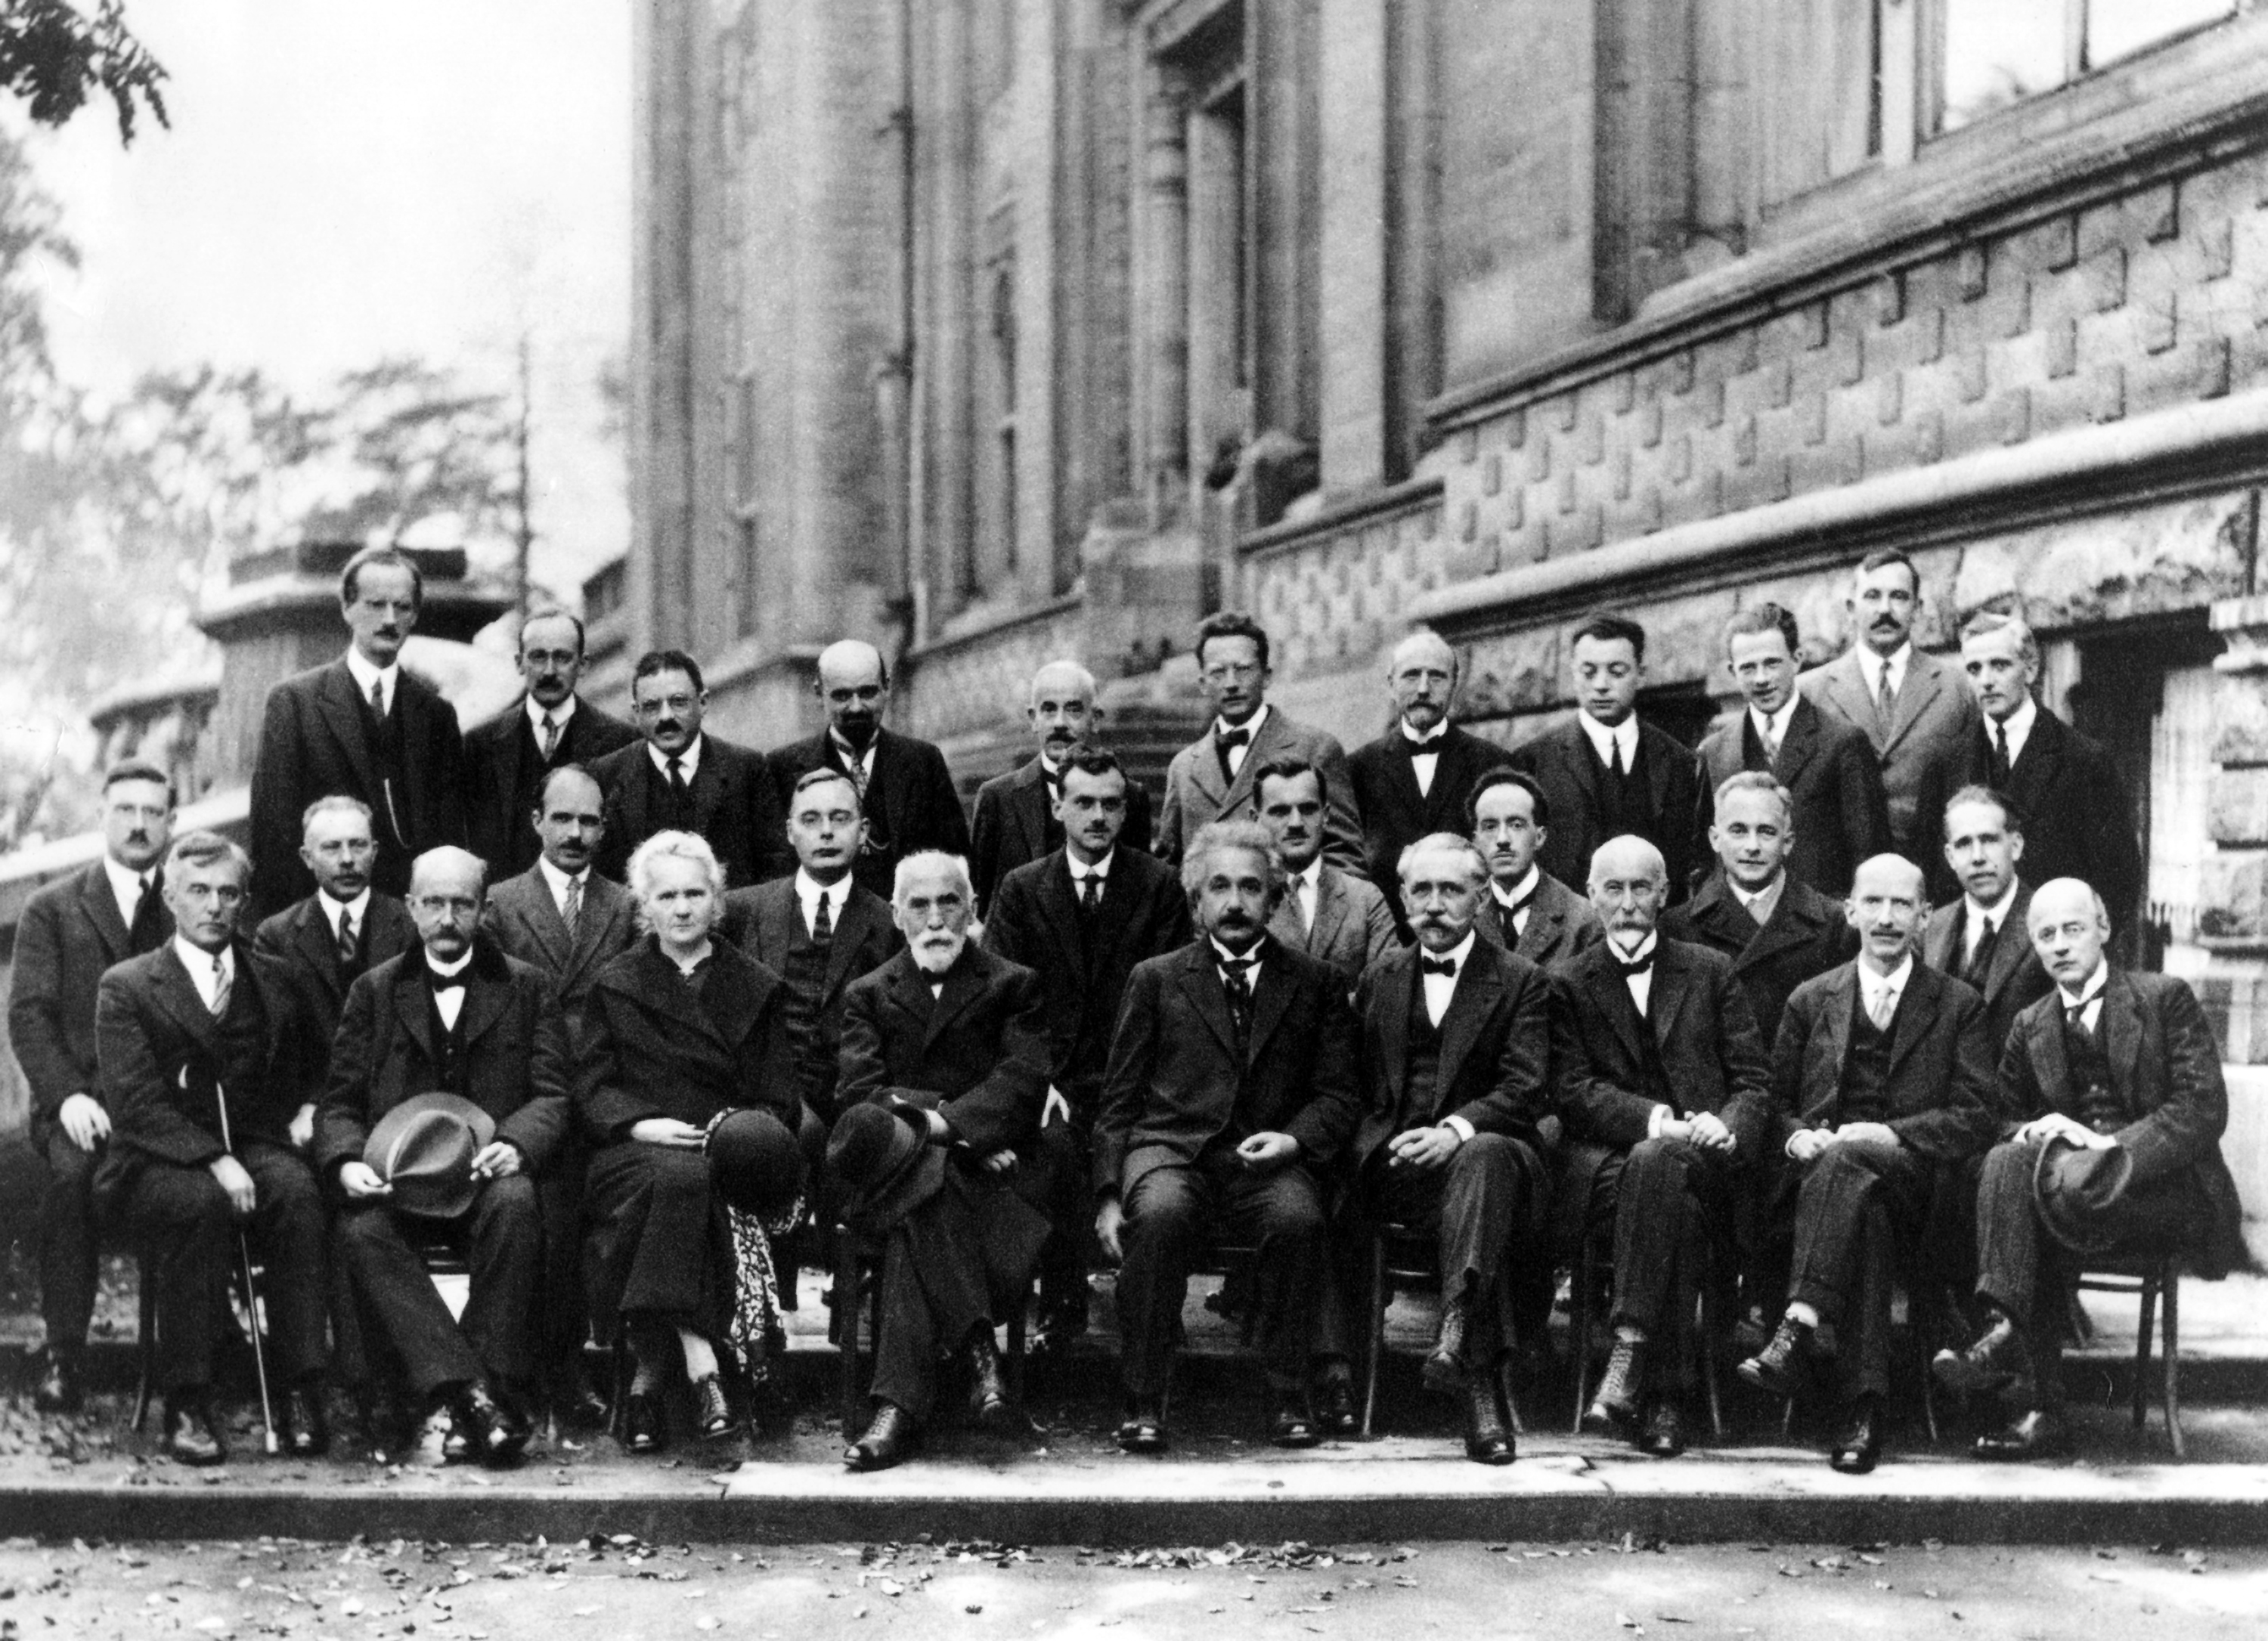
We posted previously about FACE++ and the article from Theresa Kuntzler showing how to integrate this into R. I couldn’t resist taking this for a spin one more time, on this occasion using it to examine one of the most famous conference photographs of them all, the one from the 5th Solvay Conference of 1927.
Here is the photograph, it features a veritable who’s-who of physicists and chemists from a century ago. As a physicist, seeing the people that gave rise to so many brilliant theories and techniques always brings a thrill.
 .
.
We ran the image through FACE++ to generate a tibble, called faces, of names and emotions. Here it is:
faces %>%
  select(scientist, anger:surprise) %>%
  kable("html") %>%
  kable_styling() %>%
   scroll_box(
    height = "200px",
    box_css = "border: 1px solid #ddd; padding: 5px; ",
    fixed_thead = TRUE
  )
| scientist | anger | disgust | fear | happiness | neutral | sadness | surprise |
|---|---|---|---|---|---|---|---|
| compton | 0.000 | 0.104 | 0.000 | 0.004 | 99.891 | 0.000 | 0.000 |
| langevin | 27.209 | 4.816 | 0.295 | 0.804 | 46.320 | 9.604 | 10.952 |
| debroglie | 0.151 | 0.092 | 11.442 | 0.092 | 27.725 | 38.821 | 21.677 |
| guye | 0.147 | 0.147 | 4.745 | 1.453 | 63.292 | 30.049 | 0.167 |
| born | 0.005 | 0.006 | 0.005 | 4.869 | 94.881 | 0.173 | 0.059 |
| curie | 0.000 | 0.000 | 0.000 | 0.017 | 99.982 | 0.000 | 0.000 |
| kramers | 0.026 | 0.014 | 3.978 | 0.024 | 95.930 | 0.014 | 0.014 |
| lorentz | 97.117 | 0.009 | 0.009 | 0.009 | 0.027 | 2.678 | 0.151 |
| dirac | 0.000 | 0.000 | 0.002 | 0.020 | 98.913 | 0.000 | 1.064 |
| einstein | 0.001 | 0.001 | 0.001 | 0.001 | 99.922 | 0.001 | 0.075 |
| debye | 67.131 | 0.087 | 0.182 | 0.009 | 32.355 | 0.036 | 0.199 |
| langmuir | 0.008 | 0.008 | 0.097 | 0.105 | 99.332 | 0.008 | 0.442 |
| knudsen | 0.000 | 0.000 | 0.000 | 0.000 | 100.000 | 0.000 | 0.000 |
| planck | 89.112 | 0.014 | 0.014 | 0.148 | 10.300 | 0.026 | 0.385 |
| bragg | 0.000 | 0.000 | 0.000 | 0.000 | 100.000 | 0.000 | 0.000 |
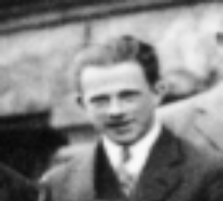
| heisenberg | 0.000 | 0.000 | 0.000 | 99.996 | 0.002 | 0.000 | 0.002 |
| fowler | 0.002 | 0.000 | 0.004 | 0.001 | 99.948 | 0.044 | 0.000 |
| brillioun | 0.001 | 0.000 | 0.006 | 0.000 | 99.991 | 0.000 | 0.002 |
| piccard | 30.095 | 0.018 | 0.056 | 0.018 | 69.260 | 0.202 | 0.349 |
| henriot | 0.002 | 0.002 | 0.027 | 0.005 | 99.938 | 0.014 | 0.012 |
| ehrenfest | 7.918 | 0.081 | 0.336 | 0.949 | 90.683 | 0.017 | 0.017 |
| herzen | 0.077 | 0.865 | 0.077 | 32.781 | 66.045 | 0.077 | 0.077 |
| dedonder | 0.012 | 0.012 | 0.053 | 12.241 | 86.798 | 0.012 | 0.872 |
| schroddinger | 0.013 | 0.000 | 0.000 | 0.001 | 99.985 | 0.000 | 0.001 |
| vershaffelt | 3.014 | 0.069 | 2.943 | 0.761 | 90.604 | 0.069 | 2.540 |
| pauli | 0.000 | 0.000 | 0.000 | 0.000 | 99.838 | 0.001 | 0.161 |
| wilson | 1.850 | 10.580 | 0.160 | 22.290 | 63.527 | 0.160 | 1.433 |
| bohr | 0.239 | 0.049 | 0.063 | 0.049 | 69.860 | 29.690 | 0.049 |
| richardson | 0.001 | 0.000 | 0.000 | 0.000 | 99.994 | 0.000 | 0.004 |
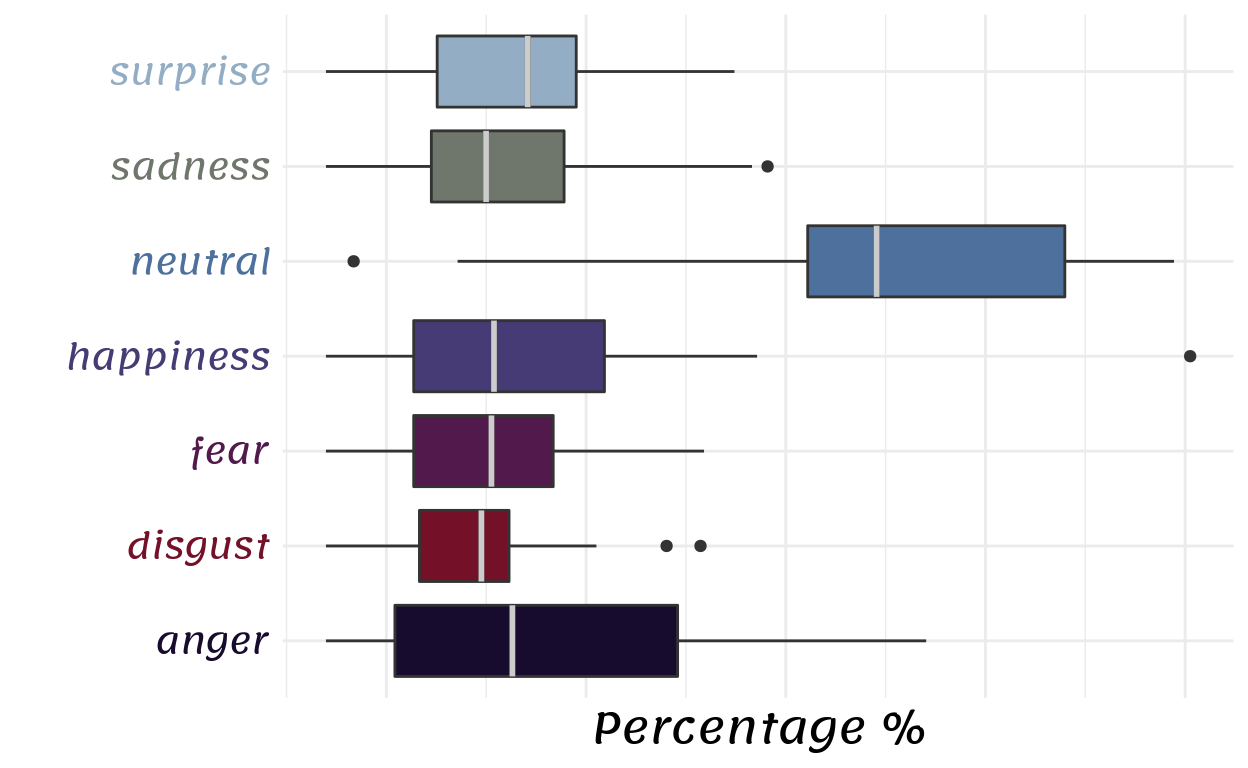
As you can see, the over-riding emotion comes out as being neutral. The modern vogue of having a sea of smiling faces for your conference photograph wasn’t obviously a thing back in 1927. But there is enough variation to warrant taking a closer look. Below we show boxplots of all seven emotions. The percentage % is transformed to a logit scale to highlight variations. From the outliers we can see signs of sadness and disgust and that someone is particularly happy.
my_colours <- paletteer::paletteer_d("yarrr::eternal", n = 7)

box <- faces %>%
  select(scientist, anger:surprise) %>%
  pivot_longer(-scientist, names_to = "emotion", values_to = "percentage") %>%
  ggplot(aes(emotion, percentage %>% gtools::logit(max = 100))) +
  geom_boxplot(aes(fill = emotion), show.legend = F) +
  scale_fill_manual(values = my_colours) +
  labs(x = "", y = "Percentage %") +
  theme(axis.text.x = element_blank(),
        axis.text.y = element_text(color = my_colours)) +
  coord_flip()

box_dat <- ggplot_build(box)$data[[1]]

box +
  geom_segment(data = box_dat,
               aes(x=xmin, xend=xmax,
                   y=middle, yend=middle),
               colour="grey80", size=1)
Heisenberg - Happiness 100 %
Lorentz - Anger 97.1 %

de Broglie - Sadness 38.8 %

It seems that FACE++ is remarkably good at picking up pretty subtle facial expressions, even in a photograph of 29 people from 94 years ago. Not bad.