There are many options to make tables in R (knitr::kable, formattable, flextable….), but gt is pretty much my favourite. It makes magnificent tables, and closely follows the philosophy, if not the syntax, of ggplot.
One problem with gt tables, is that they don’t sync well with patchwork. This is because patchwork needs grobs, and gt doesn’t do that. For most types of tables, the gridExtra::tableGrob function would do the job, but not so for gt tables. This post presents a workaround (well, really a couple of fudges), so that we can get around this. We can use the beauty of gt tables, with all the flexibility of patchwork layouts.
First off, I’d like all our tables to have the same look. So I’m going to create a common theme to apply to each of them. This is our first little hack here, as I haven’t seen this done elsewhere.
my_theme <- function(data){
  data %>%
    opt_table_font(font = google_font("Annie Use Your Telescope")) %>%
    tab_options(column_labels.background.color = "#176940",
                table.font.size = px(16)
    )
}
Next, let’s generate some tables. Let’s use the familiar penguins dataset from the palmerpengiuns package, and make the following tables:
table1 <- penguins %>%
group_by(species) %>%
summarise(weight = mean(body_mass_g, na.rm = T) %>% signif(3)/1000) %>%
ungroup() %>%
gt() %>%
my_theme()
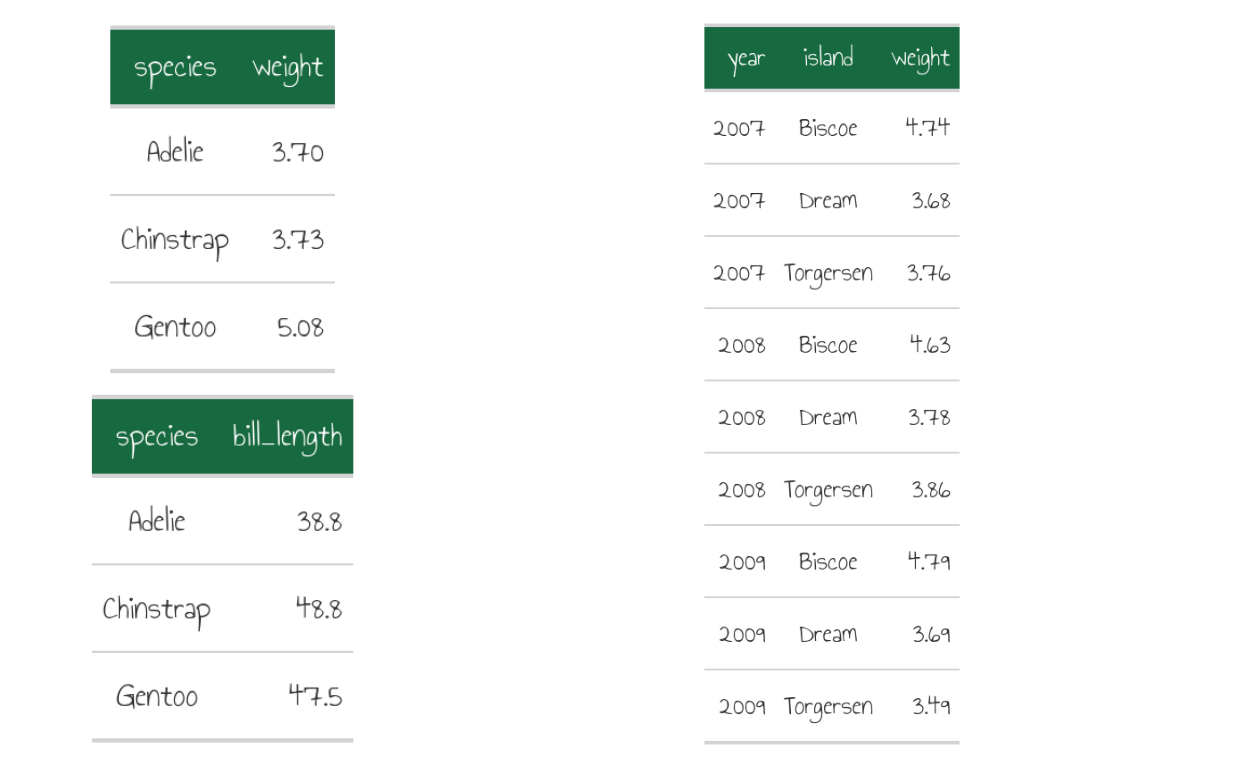
table1
| species | weight |
|---|---|
| Adelie | 3.70 |
| Chinstrap | 3.73 |
| Gentoo | 5.08 |
table2 <- penguins %>%
  group_by(species) %>%
  summarise(bill_length = mean(bill_length_mm, na.rm = T) %>% signif(3)) %>%
  ungroup() %>%
  gt() %>%
  my_theme()
table2
| species | bill_length |
|---|---|
| Adelie | 38.8 |
| Chinstrap | 48.8 |
| Gentoo | 47.5 |
table3 <- penguins %>%
  group_by(year, island) %>%
  summarise(weight = mean(body_mass_g, na.rm = T) %>% signif(3)/1000) %>%
  ungroup() %>%
  gt() %>%
  my_theme()
table3
| year | island | weight |
|---|---|---|
| 2007 | Biscoe | 4.74 |
| 2007 | Dream | 3.68 |
| 2007 | Torgersen | 3.76 |
| 2008 | Biscoe | 4.63 |
| 2008 | Dream | 3.78 |
| 2008 | Torgersen | 3.86 |
| 2009 | Biscoe | 4.79 |
| 2009 | Dream | 3.69 |
| 2009 | Torgersen | 3.49 |
Now for our second hack. We save each table in turn as a tmp file and then read it back in as a .png. This idea is from Johannes Enevoldsen given at https://github.com/rstudio/gt/issues/420.
And now the final hack. It seems like patchwork needs to kick off with an actual ggplot object, we can’t just combine tables. So we create a blank plot and then make sure it’s underneath everything when we apply the patchwork::plot_layout.
layout <- c(
  area(t=1, l=2, b=2, r=2),
  area(t=0, l=0, b=3, r=2),
  area(t=4, l=0, b=6, r=2),
  area(t=0, l=3, b=6, r=6)
)

(ggplot() + theme_void()) + table_png1 + table_png2 + table_png3 +
  plot_layout(design = layout)
And there you have it. Of course, this is just a rudimentary layout, we haven’t even begun to harness the full repetoire of either gt or patchwork. But it’s a start.