In a previous post, we looked at the course cards for various golf clubs in Donegal and beyond. In this post, we aim to see what details we can determine from these cards about the length, difficulty and pars on these holes.
These are the libraries we’ll need, and also a ggplot
theme I like to use:
library(tidyverse)
library(showtext)
library(ggokabeito)
library(viridis)
library(geomtextpath)
library(ggtext)
library(patchwork)

font_add_google(name =  "Fuzzy Bubbles", family = "Fuzzy Bubbles")
showtext_auto()
theme_clean <- function() {
  theme_minimal(base_family = "Fuzzy Bubbles") +
    theme(panel.grid.minor = element_blank(),
          text = element_text(size = 20, family = "Fuzzy Bubbles"),
          plot.background = element_rect(fill = "white", color = NA),
          axis.text = element_text(size = 20),
          axis.title = element_text(face = "bold", size = 24),
          strip.text = element_text(face = "bold", size = rel(0.8), hjust = 0),
          strip.background = element_rect(fill = "grey80", color = NA),
          legend.text = element_text(size = 16))
}
We’ll get our data as in the previous post.
course_summary <- readRDS("../2022-08-03-golf-courses-in-donegal/data/course_summary1") |>
  mutate(course = as.character(course),
         course = ifelse(course == "Dunfanaghy",
                         glue::glue("<strong><p style = 'color:#56B4E9'>{course}</p></strong>"),
                         course),
         course = as.factor(course))
donegal_golf <- readRDS("../2022-08-03-golf-courses-in-donegal/data/donegal_clean") |>
  mutate(course = as.character(course),
         course = ifelse(course == "Dunfanaghy",
                         glue::glue("<strong><p style = 'color:#56B4E9'>{course}</p></strong>"),
                         course),
         course = as.factor(course)) |>
  left_join(course_summary) |>
  mutate(course = str_remove(course, " Links") |> as.factor())
z5 <- course_summary |>
  mutate(course = fct_reorder(course, total_length))
Now let’s see what this tells us. First off, let’s look at the distribution of hole lengths for different pars.
donegal_golf |>
  ggplot(aes(yards, col = par, group = par)) +
  geom_textdensity(aes(label = glue::glue("Par\n{par}"), fill = par), stat = "density",
                size = 12, fontface = 2, hjust = "ymax", vjust = 0.3, gap = T,
                show.legend = F, linewidth = 2, family = "Fuzzy Bubbles",
                lineheight = 0.5) +
  geom_rug(show.legend = F) +
  coord_cartesian(ylim=c(0, 0.015)) +
  scale_colour_okabe_ito() +
  theme_clean() +
  theme(axis.text.y = element_blank(),
        axis.title.y = element_blank())
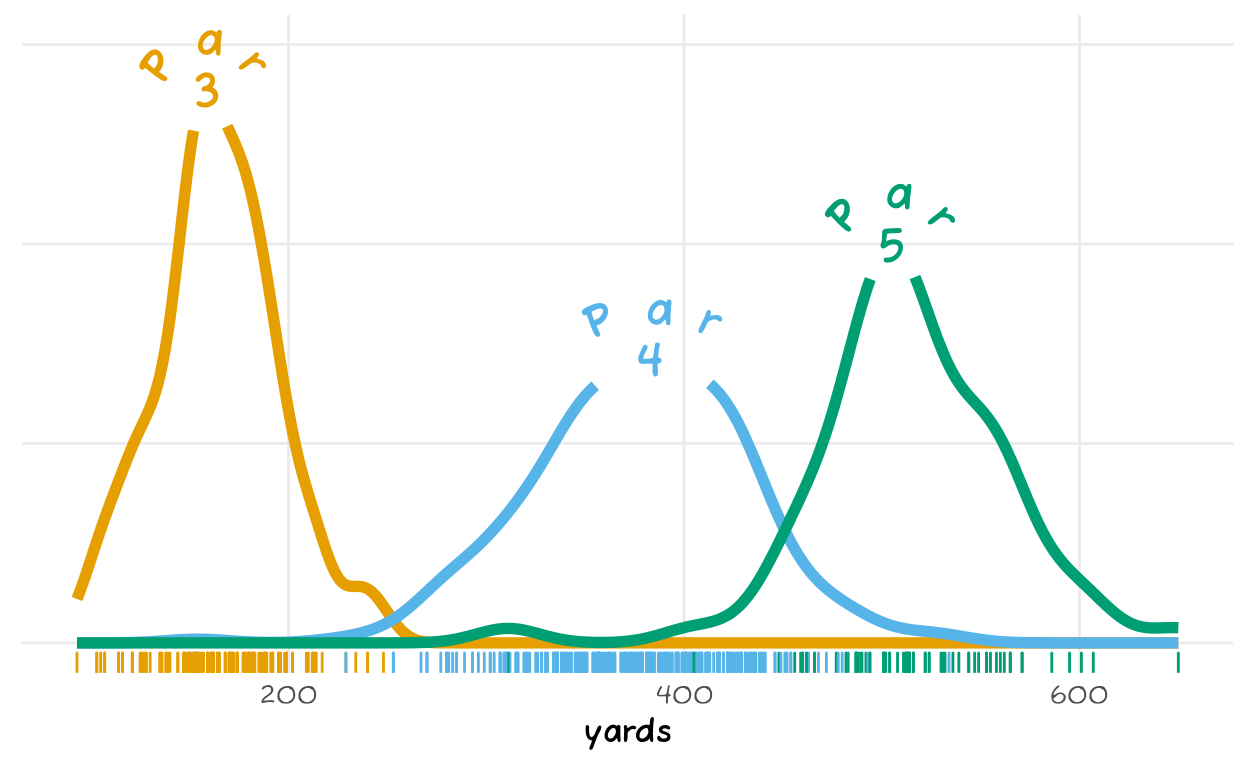
Note that there’s no overlap between par-3’s and par-4’s, if a hole is less than 250 yards, then it’s a par-3, otherwise it’s a par-4 or par-5. On the other hand, there is a lot of overlap between par-4’s and par-5’s. A par-4 can be long but relatively open and so feasible in 4 shots, whereas a par-5 can be shorter but tricky because of doglegs and hazards.
Let’s see how long these courses are:
label_size <- 9
course_summary |>
  mutate(course = fct_reorder(course, total_length),
         length_label = ifelse(total_length == max(total_length),
                               glue::glue("{total_length |> format(nsmall = 0)} yards: Par = {total_par}"),
                               glue::glue("{total_length |> format(nsmall = 0)}: {total_par}"))) |>
  ggplot(aes(course, total_length, fill = highlight)) +
  geom_col(show.legend = F) +
  geom_text(aes(label = length_label),
            size = label_size, y = 2000,
            family = "Fuzzy Bubbles",
            fontface = "bold") +
  scale_fill_manual(values = c("yes" = "#56B4E9",
                               "nine" = "#E69F00",
                               "eighteen" = "#D55E00")) +
  coord_flip() +
  theme_clean() +
  theme(axis.title = element_blank(),
        axis.text.x = element_blank(),
        axis.text.y = element_markdown(),
        )
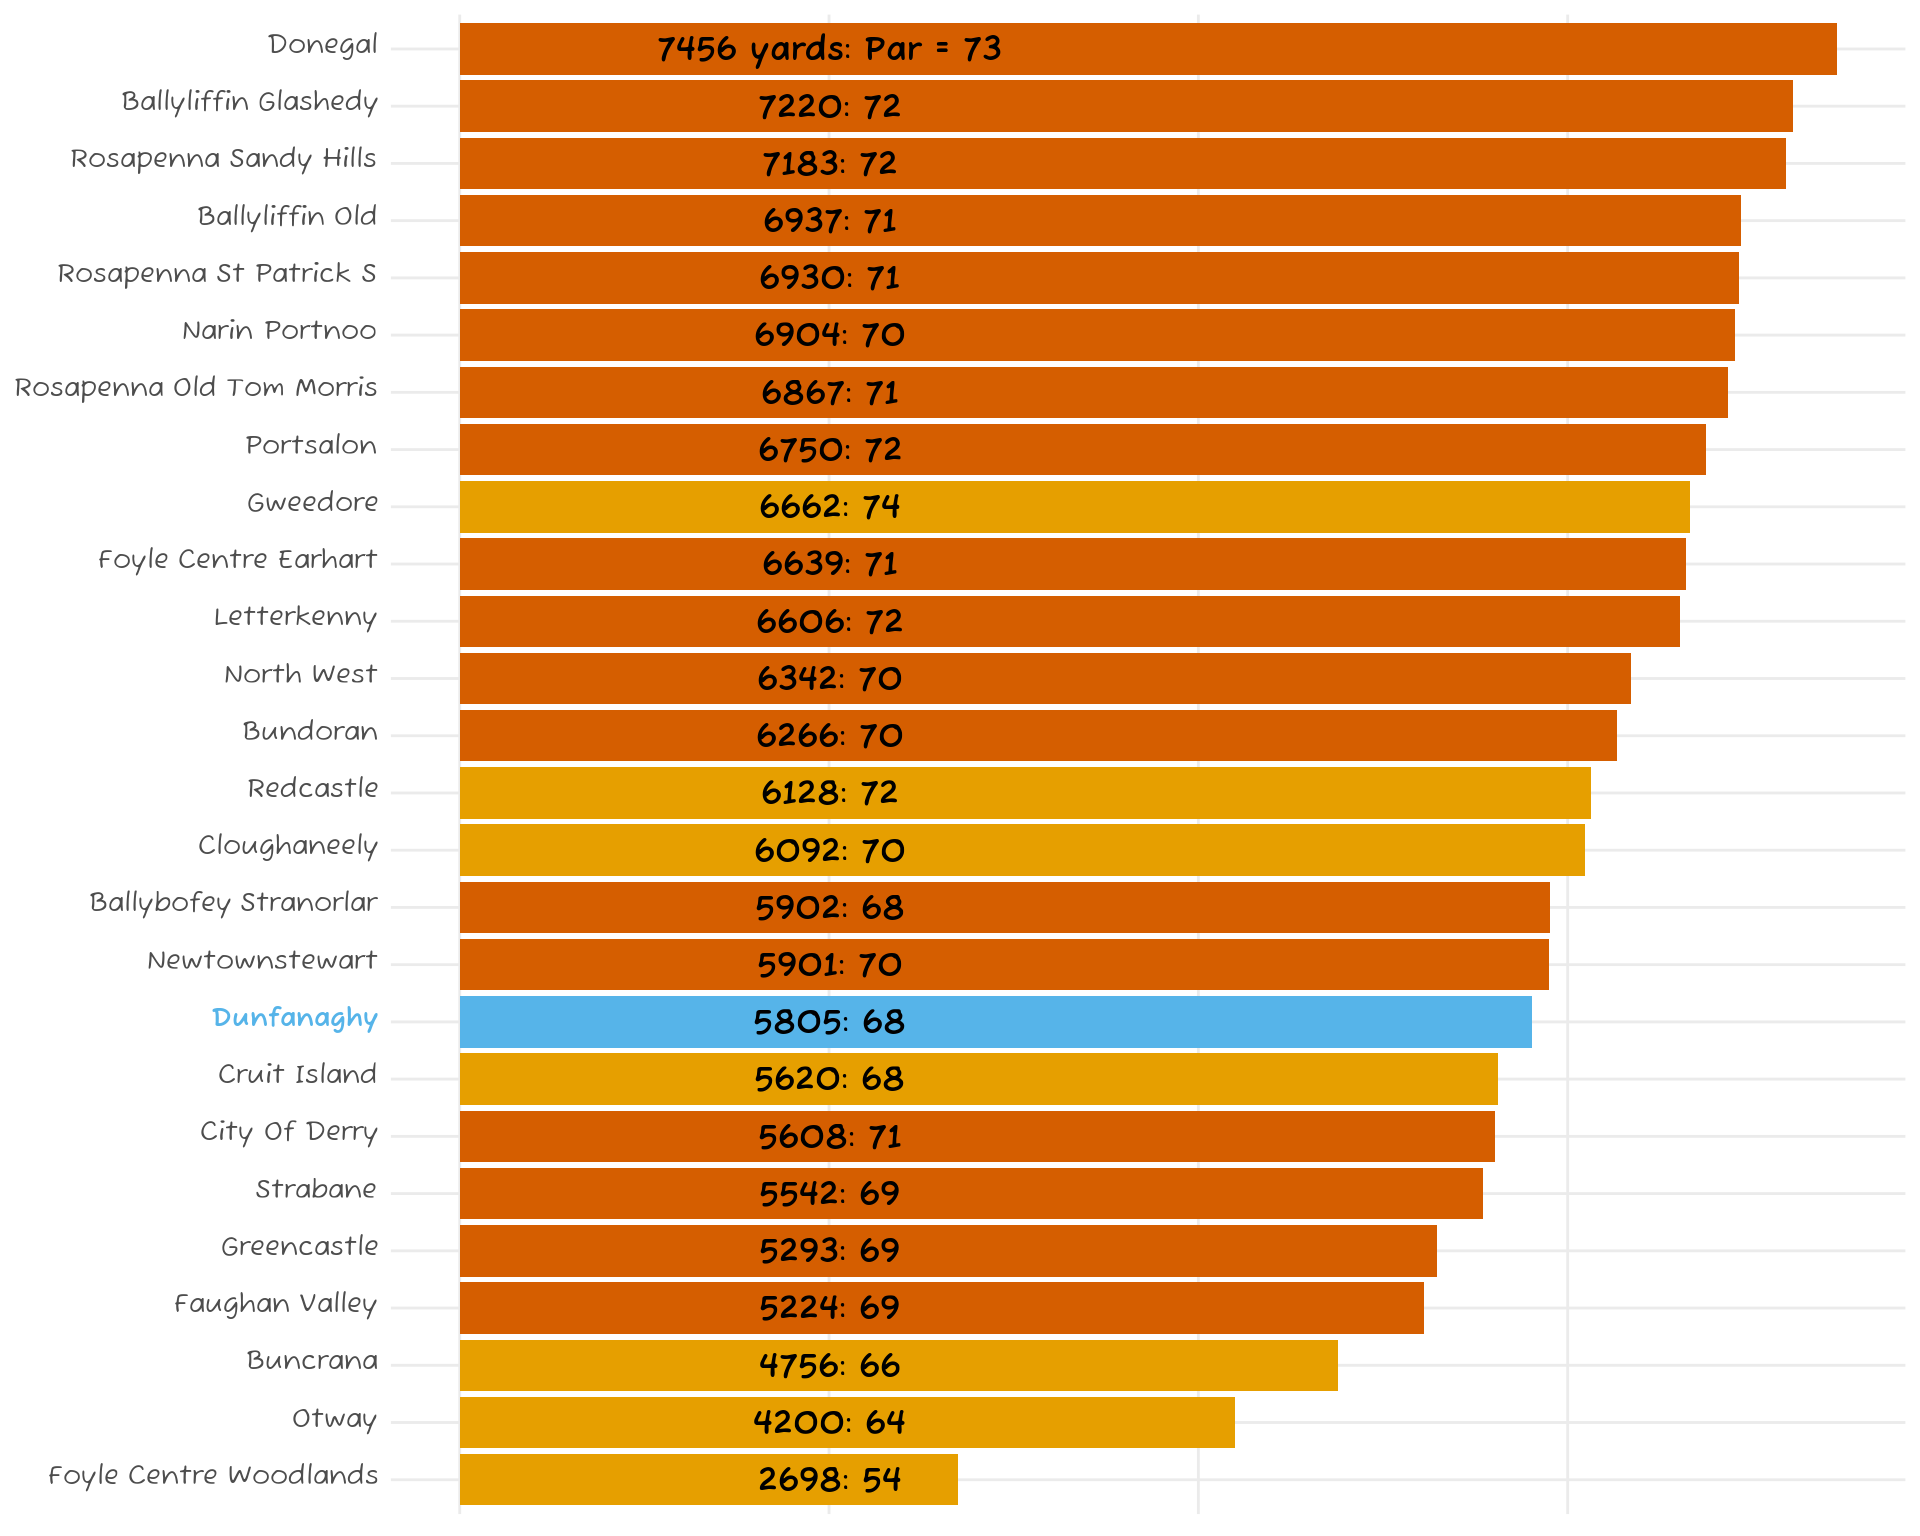
A lot of variation. The nine-hole courses (in lighter orange) tend to be shorter. And, of course, the length depends on the par of the course with the par-3 course in Foyle being the shortest and Donegal being the longest and (almost) the highest par figure.
Let’s try and normalise this by looking at the length of the par’s 3, 4, and 5 separately. The code is quite long, so we just show the part for the par 5’s. Note how rows have to be added for those three courses that don’t have a par 5.
# par 5 average length
par_5 <- donegal_golf |>
  filter(par == 5) |>
  group_by(course) |>
  summarise(total_length = mean(yards)) |>
  ungroup() |>
  left_join(z5 |> select(course, highlight)) |>
  mutate(length_par = total_length |> round(1),
         length_label = ifelse(course == levels(z5$course) |> tail(1),
                               glue::glue("{length_par |> format(nsmall = 1)} yards"),
                               length_par |> format(nsmall = 1)))|>
  distinct() |>
  add_row(course = "Otway",
          total_length = 0,
          highlight = "nine",
          length_par = 0,
          length_label = "") |>
  add_row(course = "Cruit Island",
          total_length = 0,
          highlight = "nine",
          length_par = 0,
          length_label = "") |>
  add_row(course = "Foyle Centre Woodlands",
          total_length = 0,
          highlight = "nine",
          length_par = 0,
          length_label = "") |>
  mutate(course = fct_relevel(course, levels(z5$course))) |>
  ggplot(aes(course, length_par, fill = highlight)) +
  geom_col(show.legend = F) +
  geom_text(aes(label = length_label),
            size = label_size, y=200,
            family = "Fuzzy Bubbles",
            fontface = "bold") +
  scale_fill_manual(values = c("yes" = "#56B4E9",
                               "nine" = "#E69F00",
                               "eighteen" = "#D55E00")) +
  coord_flip() +
  theme_clean() +
  theme(axis.title = element_blank(),
        axis.text.x = element_blank(),
        axis.text.y = element_blank(),
        panel.grid = element_blank()
  )

layout <- "AABBBCCCC"
par_3 + par_4 + par_5 + plot_layout(design = layout)
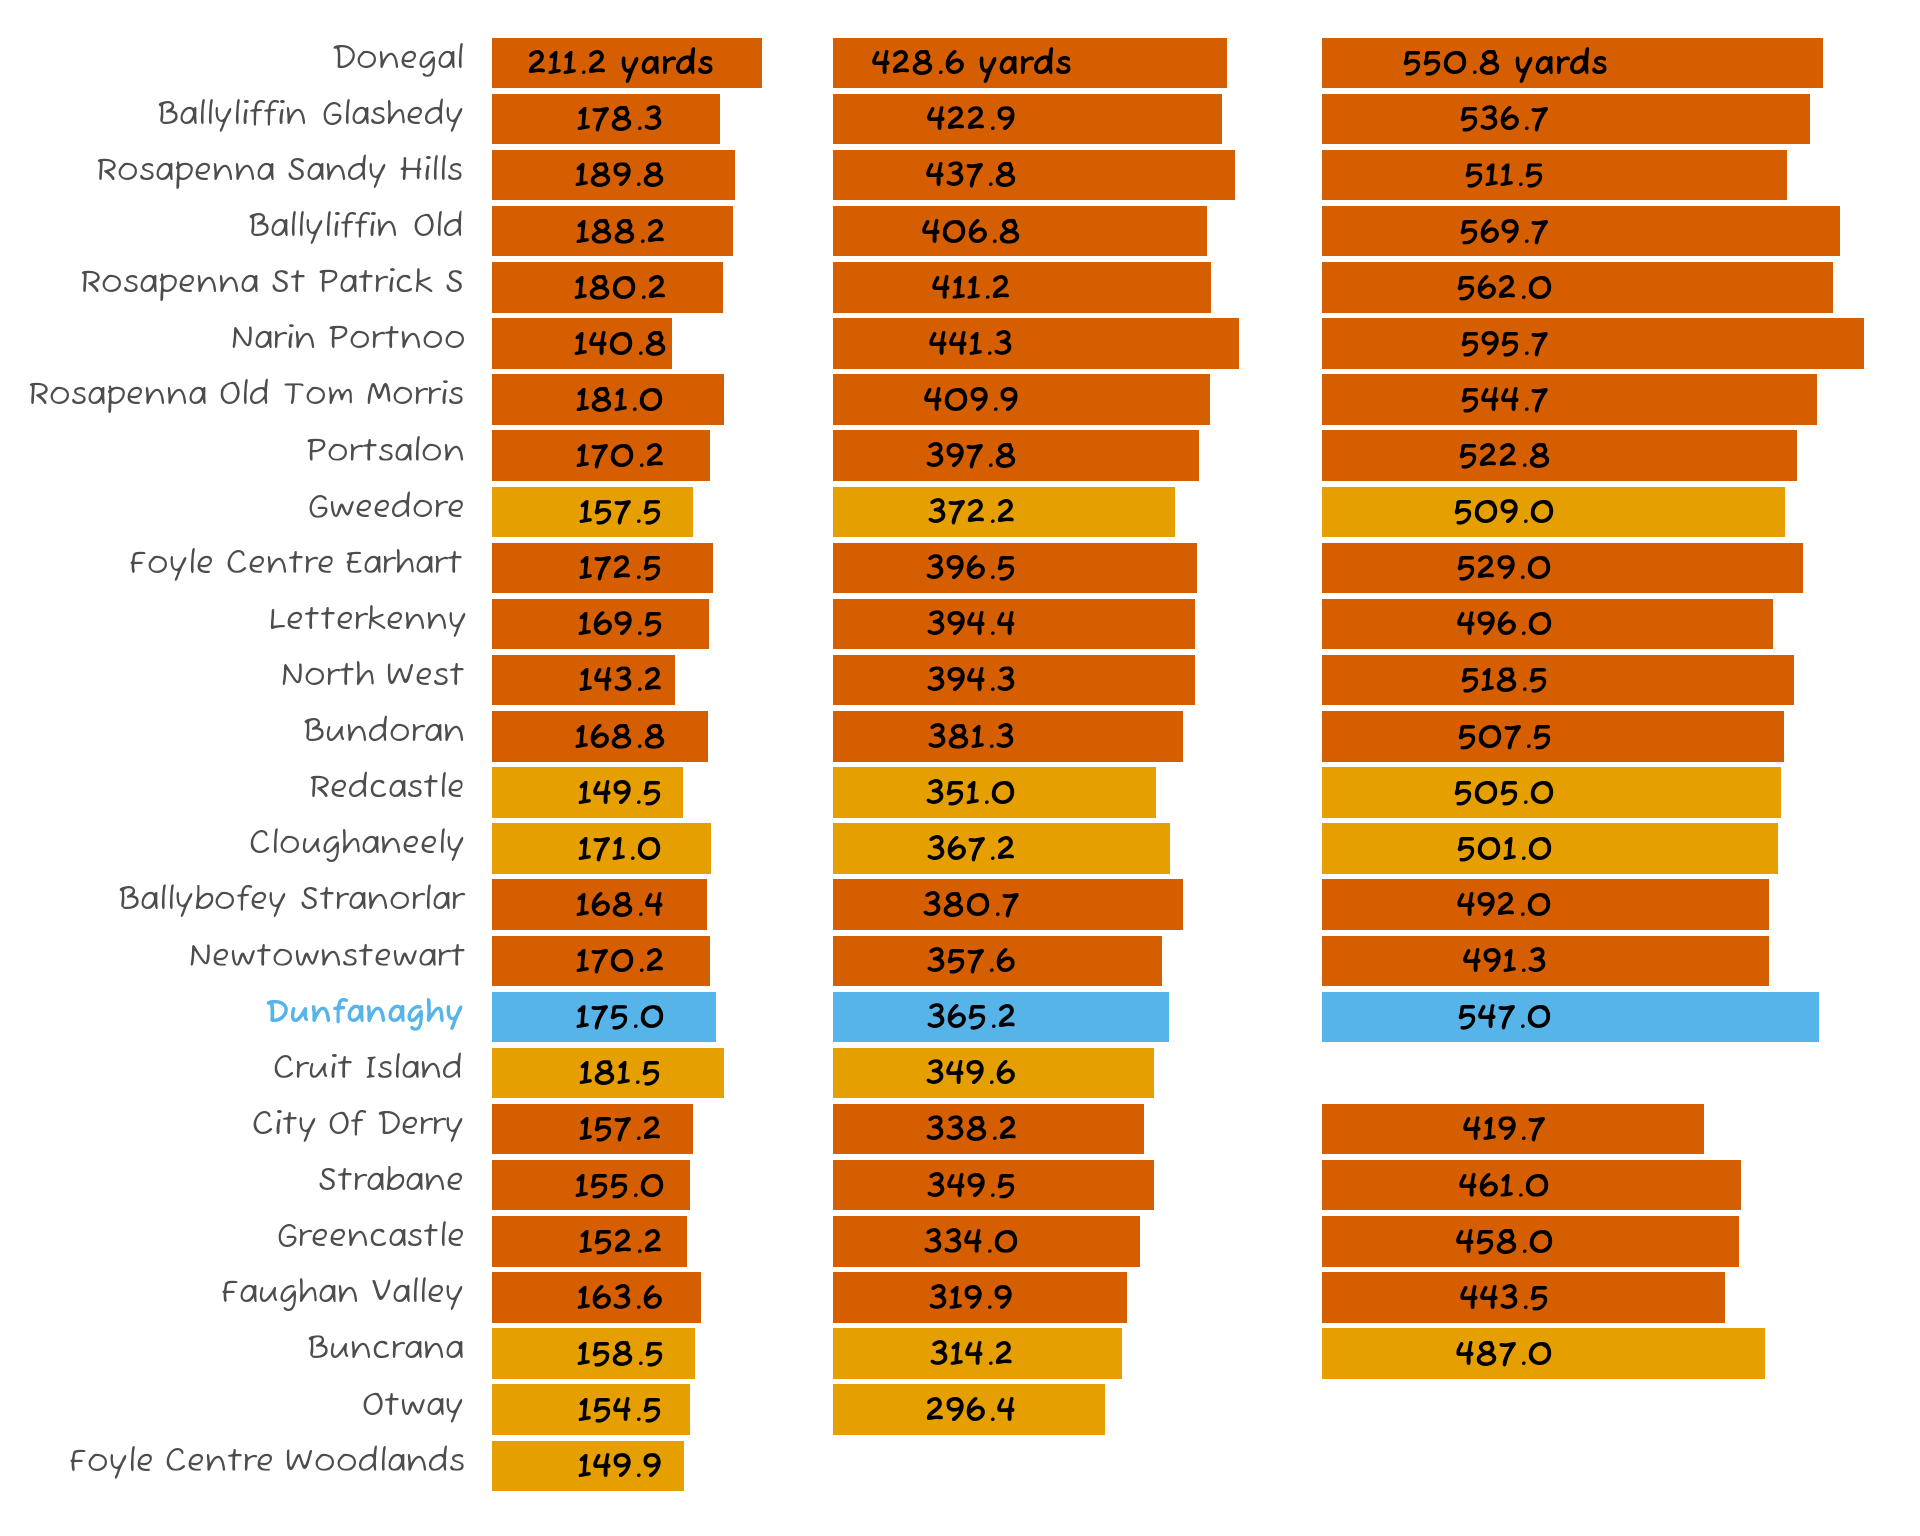
It looks like Donegal is just long. but a special mention for Portnoo, with variation that combines the shortest par 3’s with the longest par 5’s.
How does the difficulty of each hole depend on its par? To do this we use the hole index data for each course. The hole rated index 1 is considered the most difficult on a course, right down to index 18 for the easiest. In my experience, the par 3’s tend to be considered easy and so have high indices (there’s less chance of things going wrong when it’s just one shot to the green), whereas long par 4’s usually monopolise the lowest indices. Let’s see.
donegal_golf |>
  group_by(index, par) |>
  summarise(n = n()) |>
  ungroup() |>
  ggplot(aes(x = index, y = n, fill = par)) +
  geom_col(show.legend = F) +
  scale_x_continuous(breaks = c(3, 6, 9, 12, 15, 18)) +
  scale_fill_manual(values = c("#009E73", "#D55E00", "#0072B2")) +
  labs(y = "",
       title = "Variation in Hole Index for
       <strong><p style = 'color:#009E73'>Par 3's</p></strong>,
       <strong><p style = 'color:#D55E00'>Par 4's</p></strong>, and
       <strong><p style = 'color:#0072B2'>Par 5's</p></strong>") +
  theme_clean() +
  theme(plot.title = element_markdown(size = 30),
        axis.text.y = element_blank())
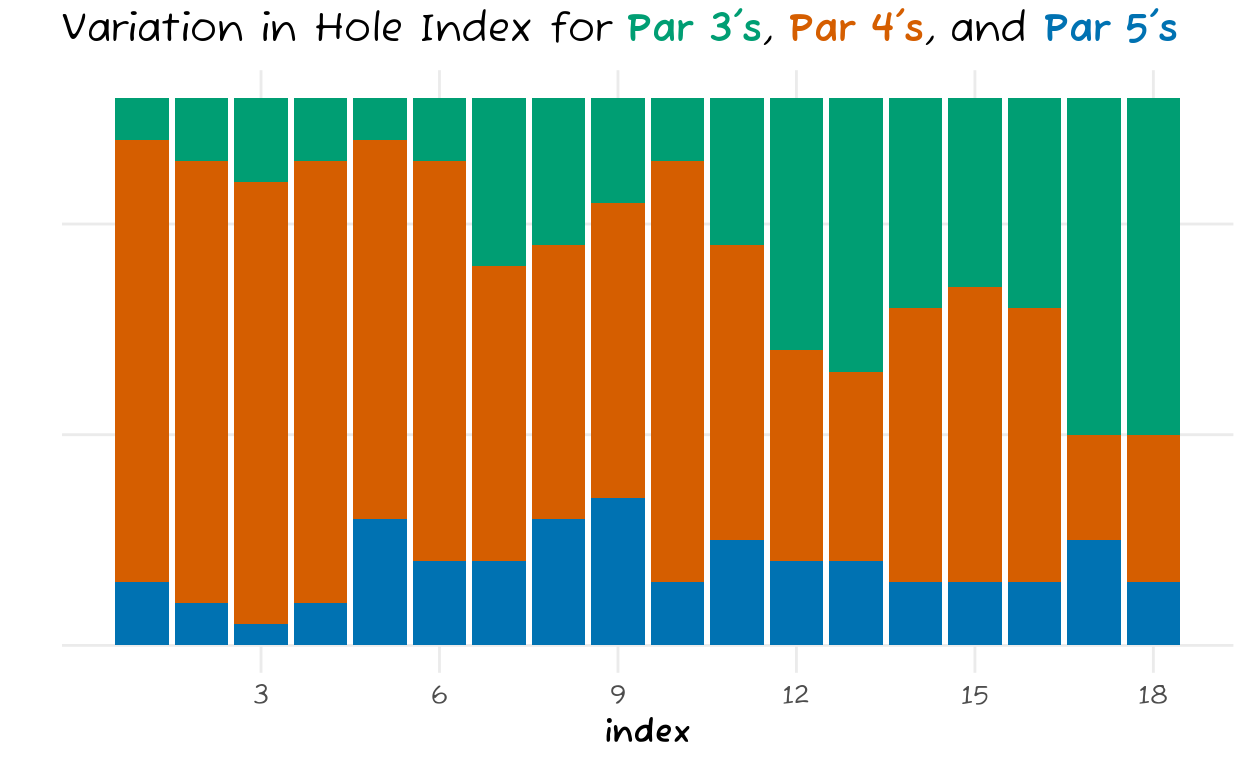
Looks like our hunch was good, with par 3’s having an increasing presence among the higher index holes, whereas the par 4’s dominate the lower indices. Par 5’s, meanwhile, seem to have an even index probability once you get beyond index 4 or so.
This concludes our walk around the courses of Donegal. If you enjoy the game, they come highly recommended for their beauty, the varied challenges they pose, and from the warm reception afforded to visitors.