Geological Survey Ireland is producing wonderful data resources, impossible to resist when it comes to doing some analysis. In this post, welook at bedrock data, what you would see after sweeping away all the soil and loose covering from the ground. Bedrock is stuff like sandstone, limestone, igneous rock….
I was interested to see how overlying vegetation depends on the bedrock; specifically if the colours from satellite images taken at different times of year could be used to take a guess at what lies beneath.
This requires two suites of information, the bedrock data from GSI and the satellite data from Copernicus-Sentinel. The first we’ll download directly and store locally from this resource, the second we’ll access using the R package, sen2r (but we’ll also end up downloading and storing image files locally, but sen2R will help scope them out).
This was originally written as one post, but then it got so long I decided to split it into three parts:
- Part I: getting the bedrock data from GSI
- Part II: getting the satellite data from Sentinel
- Part III: putting the first two together
A reminder, from part I, we accessed a map of bedrock data from GSI, this is ploted on the left below. From part II, we recruited three sets of satelllite images from Sentinel; one from June, one end-August, and the last from December 2022. Stacking these together gives us the middle plot. In addition, the right hand plot shows the August vegetation index NDVI, areas of darker green have more plant life.
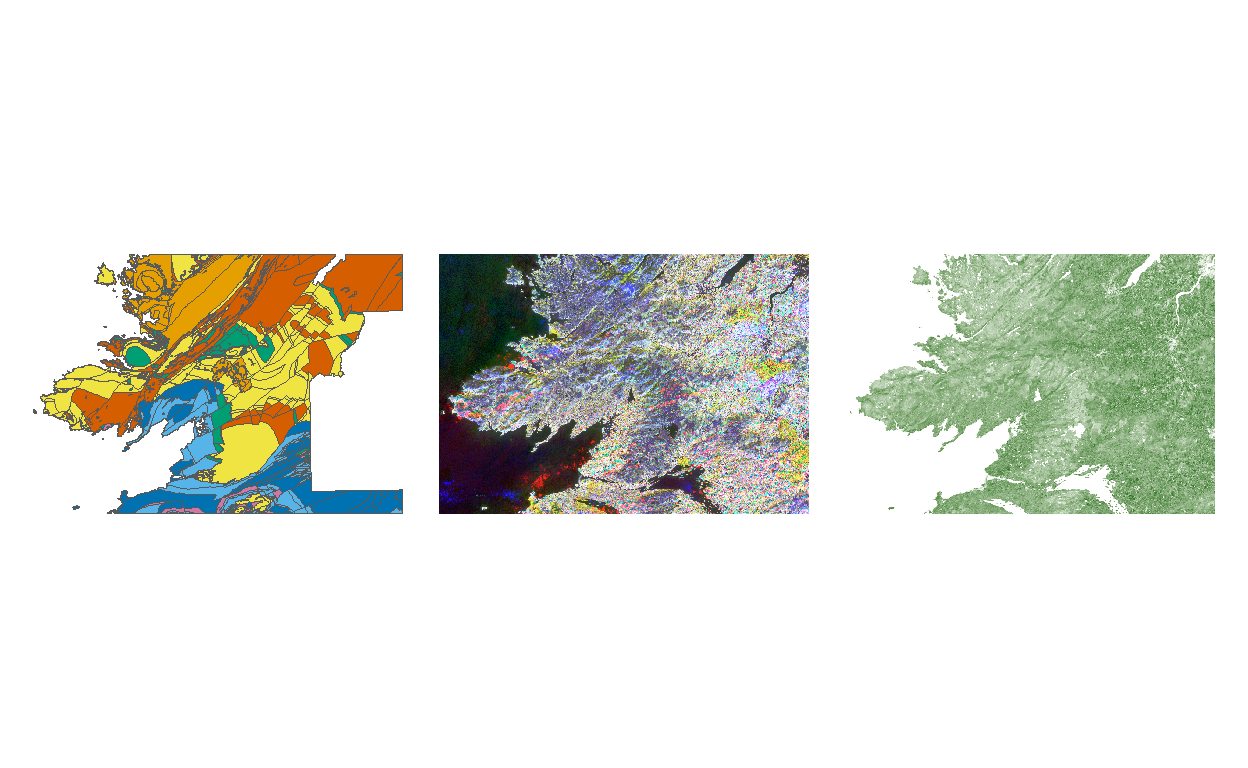
The RGB colours from the raster image (in the center above) come from setting R to the NIR channel from June, G to the NIR channel of August, and B to the NIR channel of December. The red flecks over Donegal Bay correspond to clouds in the June image, the bue flecks to clouds in December (this is Ireland afterall)
It looks like there is some correspondence between bedrock and satellite here. The orange granite in the NorthWest quarter mapping to purple colours from the satellite stack, schist (brown) being lighter, and the arc of blue sandstone and limestone around Donegal Bay also apparent in the satellite photographs. None of this is too surprising; vegetation and growth on mountains will be different to that on plains. But it leads us on to our next step, can we determine the rock types based on what the satellite images are telling us? And using the red, green, blue bands as well as the near infra-red?
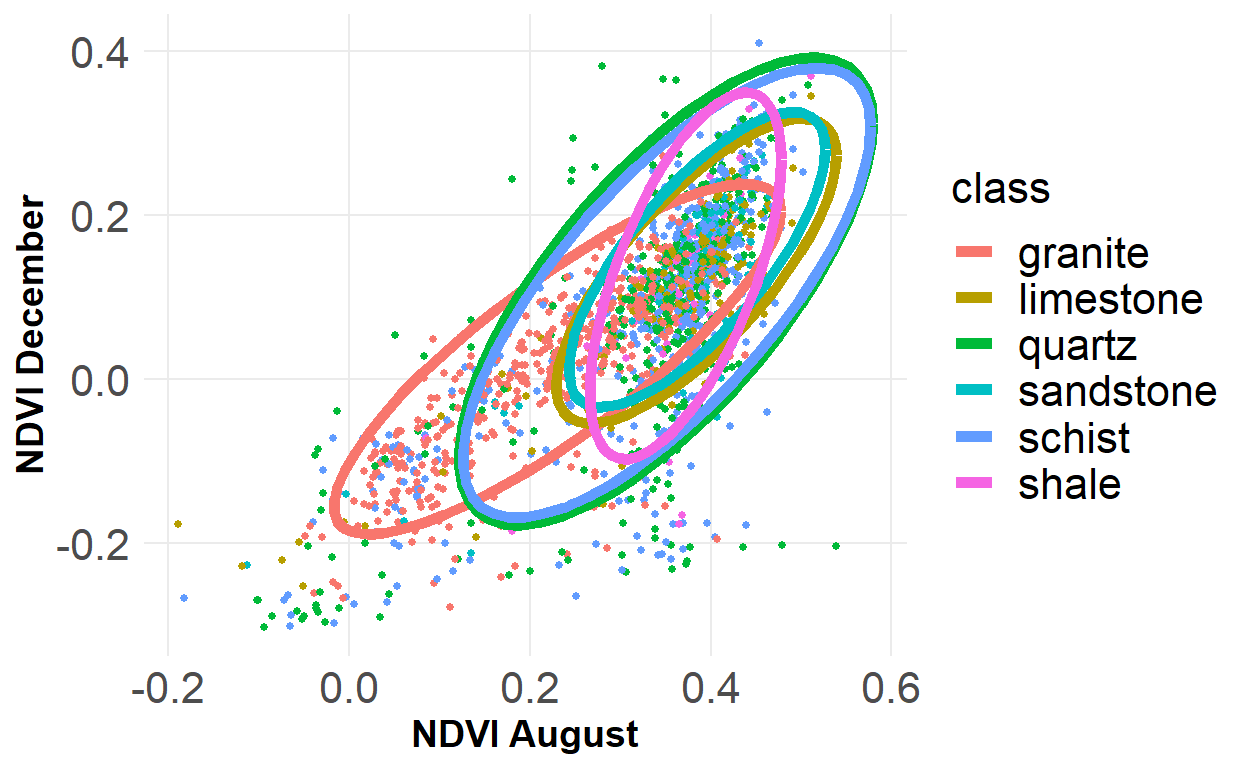
Next we take the polygons defining areas in the bedrock map and use the exactextractr package to calculate the mean values of the satellite images in these areas. We then plot the NDVI values for these areas, colouring and circling them by rock type.